
Note
Go to the end to download the full example code.
Inferring topology from atom coordinates#
Quantum chemistry programs typically report the result of a geometry optimization as a bare list of elements and coordinates, for example in the XYZ format. Which atoms are bonded to each other, let alone the bond orders and formal charges, is not part of such an output.
This information is required for a lot of downstream tasks though, so this example demonstrates how to reconstruct the bond graph (i.e. the topology) from coordinates alone. Finally, the assigned bond orders are compared with the Wiberg bond indices from the DFT calculation.
As input the DFT-optimized geometry (B3LYP-D3BJ/DZVP) of the antibiotic ciprofloxacin is fetched from the MolSSI QCArchive [1], more precisely from the FDA Optimization Dataset 1 of the Open Force Field Initiative. Ciprofloxacin is an instructive test case, as it is a zwitterion: The piperazine nitrogen is protonated and the carboxyl group is deprotonated, so the formal charges must be placed correctly, although the total charge of the molecule is zero.
# Code source: Patrick Kunzmann
# License: BSD 3 clause

import matplotlib.pyplot as plt
import numpy as np
import requests
import biotite
import biotite.interface.pymol as pymol_interface
import biotite.structure as struc

QCARCHIVE_URL = "https://api.qcarchive.molssi.org/api/v1/"
# The QCArchive ID of the molecule to fetch:
# This is the final geometry of the optimization record '6095247', i.e. the first
# conformer of ciprofloxacin in the 'FDA Optimization Dataset 1'
MOLECULE_ID = 3954680
# The QCArchive ID of the final single point calculation of that optimization,
# which provides the Wiberg bond indices
RECORD_ID = 6357374
# QCArchive reports coordinates in atomic units
BOHR_TO_ANGSTROM = 0.529177210903
The QCArchive REST API returns the molecule as JSON, which contains the element
symbols and a flat list of coordinates, among other data.
Only these two fields are used to build the AtomArray, exactly as if the
geometry was read from an XYZ file.
The total charge of the molecule is taken from the record as well, as it is required
as constraint for the bond order assignment later.
response = requests.get(QCARCHIVE_URL + f"molecules/{MOLECULE_ID}")
response.raise_for_status()
record = response.json()

molecule = struc.AtomArray(len(record["symbols"]))
molecule.coord = np.array(record["geometry"]).reshape(-1, 3) * BOHR_TO_ANGSTROM
molecule.element = np.char.upper(record["symbols"])
molecule.res_name[:] = "UNL"
molecule.res_id[:] = 1
molecule.hetero[:] = True
molecule.atom_name = struc.create_atom_names(molecule)
total_charge = int(record["molecular_charge"])
The topology is reconstructed in two steps:
connect_via_distances() determines which atoms are bonded to each other based
on their distances and covalent radii, and infer_bond_types() assigns bond
orders and formal charges to these bonds, so that each atom satisfies its valence and
the formal charges sum up to the total charge of the molecule.
The formal charges are stored as charge annotation for use in the following steps.
molecule.bonds = struc.connect_via_distances(molecule)
molecule.bonds, charges = struc.infer_bond_types(molecule, total_charge)
molecule.set_annotation("charge", charges)

print("Number of bonds:", molecule.bonds.get_bond_count())
bond_types = molecule.bonds.as_array()[:, 2]
for bond_type in np.unique(bond_types):
    count = np.count_nonzero(bond_types == bond_type)
    print(f"{struc.BondType(bond_type).name}: {count}")
print("Charged atoms:")
for i in np.where(molecule.charge != 0)[0]:
    print(f"    {molecule.atom_name[i]}: {molecule.charge[i]:+d}")
Number of bonds: 45
SINGLE: 39
DOUBLE: 6
Charged atoms:
    N3: +1
    O1: -1
For the visualization the molecule is rendered with PyMOL.
The heavy atoms are labeled with their names to be able to identify them in the
following analysis, and the formal charges are indicated by +/- signs.
pymol_obj = pymol_interface.PyMOLObject.from_structure(molecule)
pymol_obj.show("sticks")
pymol_obj.color("white", molecule.element == "H")
# Lighter carbon atoms give a better contrast to the labels
pymol_obj.color((0.7, 0.7, 0.7), molecule.element == "C")
pymol_interface.cmd.set("stick_radius", 0.15)
# Draw double bonds as two parallel sticks
pymol_interface.cmd.set("valence", 1)
pymol_interface.cmd.set("valence_size", 0.1)
# Label the heavy atoms with their names
for i in np.where(molecule.element != "H")[0]:
    pymol_obj.label(i, molecule.atom_name[i])
pymol_interface.cmd.set("label_size", 14)
# Offset the labels from their atoms, so that they do not hide each other
pymol_interface.cmd.set("label_position", (1.5, -1.5, 4))
# As an atom can only have a single label, the formal charges are indicated by
# labeled pseudoatoms at the positions of the charged atoms
for i in np.where(molecule.charge != 0)[0]:
    pymol_interface.cmd.pseudoatom(
        "charges",
        pos=molecule.coord[i].tolist(),
        label="+" if molecule.charge[i] > 0 else "-",
    )
pymol_interface.cmd.set("label_size", 35, "charges")
pymol_interface.cmd.set("label_position", (0.4, 0.4, 4), "charges")
pymol_interface.cmd.orient()
pymol_interface.show((1500, 1000))
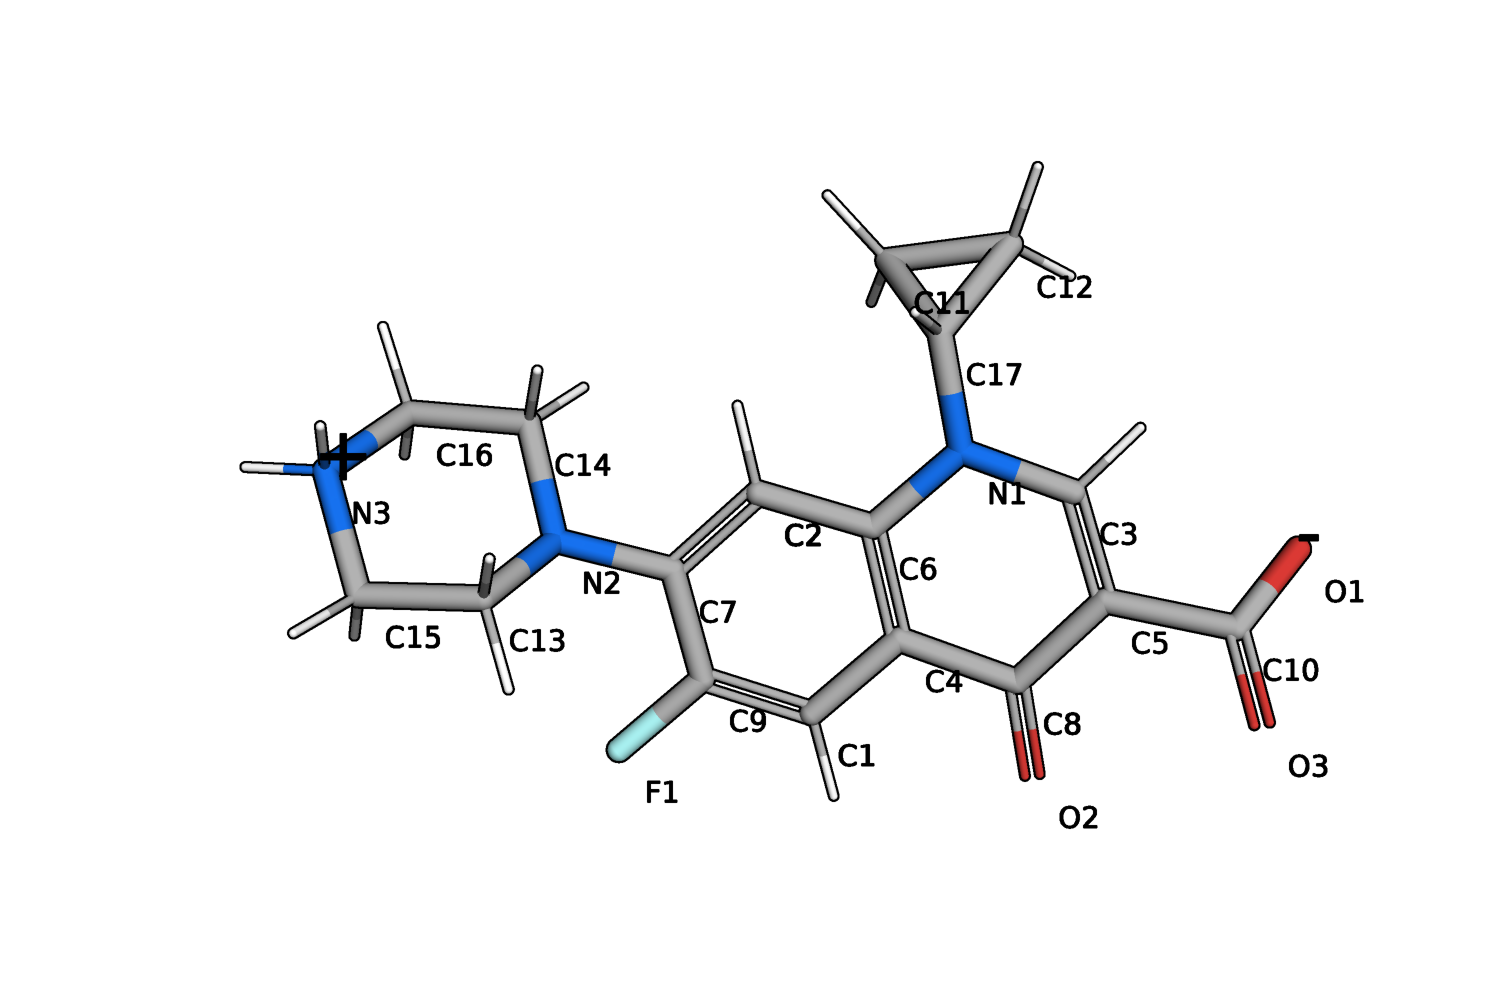
How well do the assigned integer bond orders reflect the electronic structure? The DFT calculation provides the Wiberg bond indices, a quantum mechanical measure of the bond order between each pair of atoms. They are stored in the QCArchive record of the final single point calculation of the geometry optimization. In the following plot the Wiberg index of each atom pair is compared with its assigned bond order, where pairs without a bond count as bond order zero. Bonds whose Wiberg index deviates strongly from the assigned bond order are labeled.
response = requests.get(QCARCHIVE_URL + f"records/singlepoint/{RECORD_ID}")
response.raise_for_status()
properties = response.json()["properties"]
n_atoms = molecule.array_length()
wiberg_indices = np.array(properties["wiberg lowdin indices"]).reshape(n_atoms, n_atoms)

# Consider each atom pair only once
atom_i, atom_j = np.triu_indices(n_atoms, k=1)
pair_wiberg_indices = wiberg_indices[atom_i, atom_j]
# The values of the single, double and triple bond types correspond to the bond order,
# non-bonded pairs are marked with -1 in the bond type matrix
bond_orders = molecule.bonds.bond_type_matrix()[atom_i, atom_j].astype(int)
bond_orders[bond_orders == -1] = 0
hydrogen_mask = (molecule.element[atom_i] == "H") | (molecule.element[atom_j] == "H")

fig, ax = plt.subplots(figsize=(8.0, 5.0))
# Spread the points horizontally to reduce overlap
x = bond_orders + np.random.default_rng(0).uniform(-0.15, 0.15, len(bond_orders))
for mask, color, label in [
    (bond_orders == 0, "gray", "No bond"),
    (
        (bond_orders != 0) & hydrogen_mask,
        biotite.colors["dimgreen"],
        "Bond to hydrogen",
    ),
    (
        (bond_orders != 0) & ~hydrogen_mask,
        biotite.colors["dimorange"],
        "Heavy atom bond",
    ),
]:
    ax.scatter(x[mask], pair_wiberg_indices[mask], s=20, color=color, label=label)
for i in np.where(np.abs(pair_wiberg_indices - bond_orders) > 0.5)[0]:
    # Put the label on the side of the point that faces the plot center
    on_left_side = bond_orders[i] > 1
    ax.annotate(
        f"{molecule.atom_name[atom_i[i]]}-{molecule.atom_name[atom_j[i]]}",
        (x[i], pair_wiberg_indices[i]),
        xytext=(-8 if on_left_side else 8, 0),
        textcoords="offset points",
        ha="right" if on_left_side else "left",
        va="center",
    )
ax.set_xticks([0, 1, 2])
ax.set_xticklabels(["none", "single", "double"])
ax.set_xlabel("Assigned bond order")
ax.set_ylabel("Wiberg bond index")
ax.legend(loc="upper left")
fig.tight_layout()
plt.show()
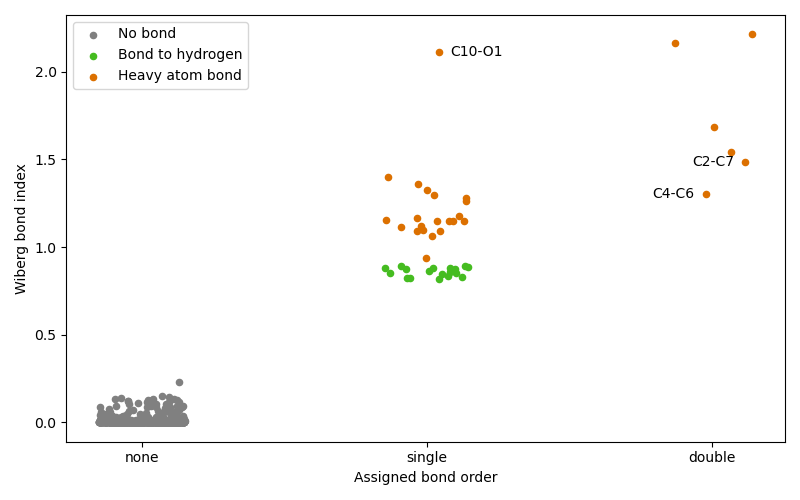
The Wiberg indices of all non-bonded pairs are far below the ones of bonded pairs, which confirms the connectivity found via atom distances. Bonds to hydrogen and most single bonds between heavy atoms have Wiberg indices close to one and the carbonyl double bonds are close to two, as expected.
The labeled bonds are those, where the assigned integer bond order is furthest from the Wiberg index. All of them are cases of resonance: The molecule cannot be described properly by a single Lewis structure, but only by the superposition of multiple ones, so its electrons are delocalized over several bonds. The assigned bond orders and formal charges represent only one of these resonance structures, while the Wiberg indices reflect the actual delocalized electrons.