


Note
Go to the end to download the full example code
Mutual information as measure for coevolution of residues
Mutual information (MI) is a broadly used measure for the coevolution between two residues of a sequence 1 originated in information theory. Basically, the mutual information is a statement about how much knowledge one already has about a distribution \(Y\), knowing another distribution \(X\):
In the context of a protein the amino acid sequence is aligned to multiple homologous sequences. The distribution is the distribution of amino acids in a alignment column. When mutations in one column are often associated with certain mutations in another alignment column, the MI between these two positions is high. This indicates that these two sequence positions might have evolved together (coevolution).
In order to suppress randomly high or low MI due to general conservation in an alignment column, the MI of the given alignment is compared to variants of this alignment, where each alignment column is randomly shuffled. The results are aggregated into a Z-score:
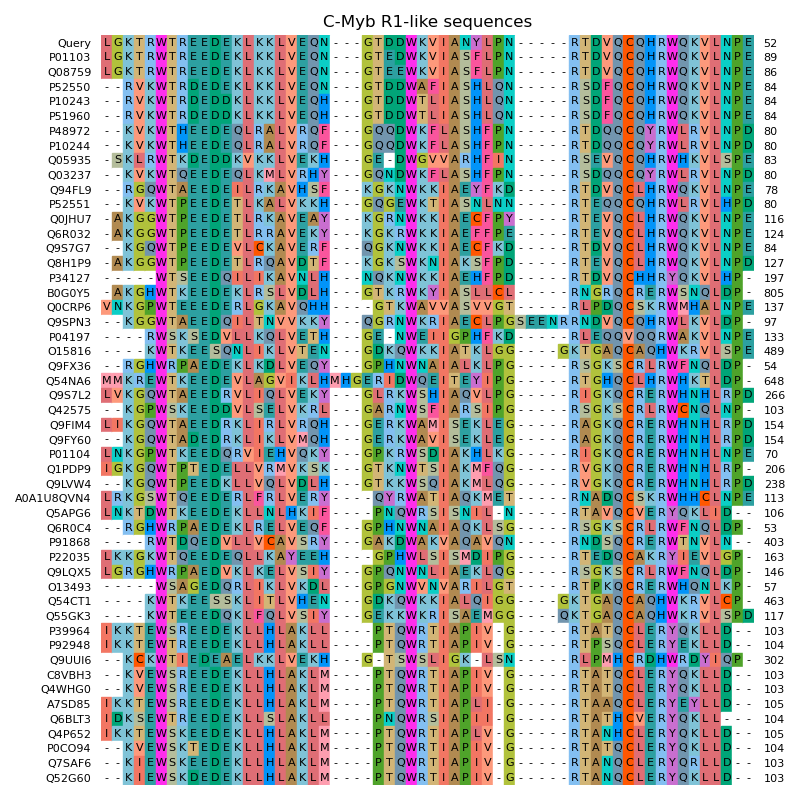
This example demonstrates this method on the example of the C-Myb DNA-binding domain (C-Myb R1) (PDB: 1GUU). At first, sequences of homologous proteins are searched in the curated SwissProt database via NCBI BLAST. Afterwards these sequences are aligned with Clustal Omega.
- 1
L. C. Martin, G. B. Gloor, S. D. Dunn, L. M. Wahl, “Using information theory to search for co-evolving residues in proteins,” Bioinformatics, vol. 21, pp. 4116–4124, November 2005. doi: 10.1093/bioinformatics/bti671
# Code source: Patrick Kunzmann
# License: BSD 3 clause

import warnings
import numpy as np
import matplotlib.pyplot as plt
import matplotlib.colors as colors
import biotite
import biotite.structure as struc
import biotite.structure.io.pdbx as pdbx
import biotite.sequence.align as align
import biotite.sequence.graphics as graphics
import biotite.application.blast as blast
import biotite.application.clustalo as clustalo
import biotite.database.rcsb as rcsb


# Get structure and sequence
pdbx_file = pdbx.CIFFile.read(rcsb.fetch("1GUU", "mmcif"))
sequence = pdbx.get_sequence(pdbx_file)[0]
# 'use_author_fields' is set to false,
# to ensure that values in the 'res_id' annotation point to the sequence
structure = pdbx.get_structure(pdbx_file, model=1, use_author_fields=False)
structure = structure[struc.filter_amino_acids(structure)]

# Identity threshold for a sequence to be counted as homologous sequence
IDENTITY_THESHOLD = 0.4
# Find homologous proteins in SwissProt via BLAST
app = blast.BlastWebApp("blastp", sequence, database="swissprot")
app.start()
app.join()
alignments = app.get_alignments()
hit_seqs = [sequence]
hit_ids = ["Query"]
hit_starts = [1]
for ali in alignments:
    identity = align.get_sequence_identity(ali)
    # Do not include the exact same sequence -> identity < 1.0
    if identity > IDENTITY_THESHOLD and identity < 1.0:
        hit_seqs.append(ali.sequences[1])
        hit_ids.append(ali.hit_id)
        hit_starts.append(ali.hit_interval[0])

# Perform MSA
alignment = clustalo.ClustalOmegaApp.align(hit_seqs)

# Plot MSA
number_functions = []
for start in hit_starts:
    def some_func(x, start=start):
        return x + start
    number_functions.append(some_func)
fig = plt.figure(figsize=(8.0, 8.0))
ax = fig.gca()
graphics.plot_alignment_type_based(
    ax, alignment, symbols_per_line=len(alignment), labels=hit_ids,
    symbol_size=8, number_size=8, label_size=8,
    show_numbers=True, number_functions=number_functions,
    color_scheme="flower"
)
ax.set_title("C-Myb R1-like sequences")
fig.tight_layout()
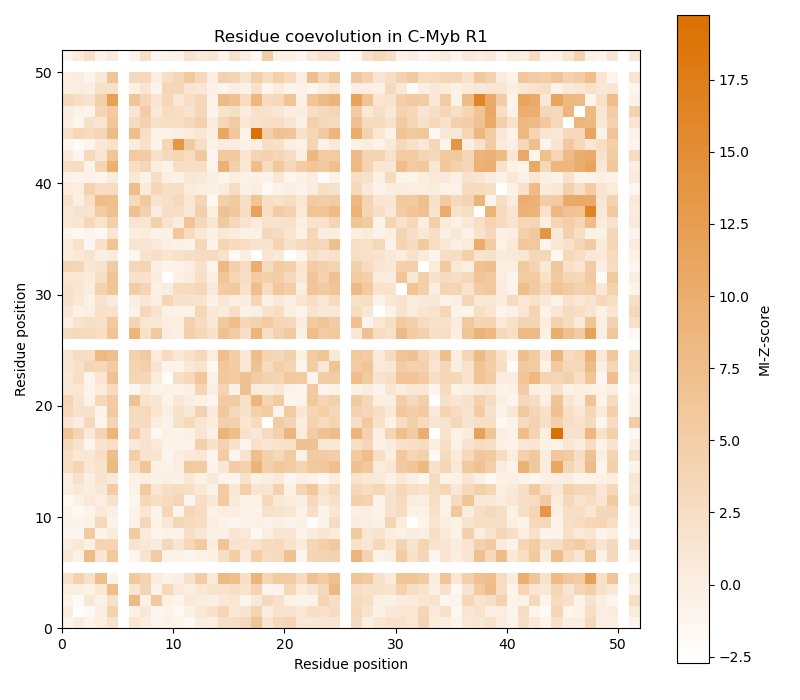
Now the MI is calculated from the multiple sequence alignment and from column-shuffled variants of it to obtain the MI-Z-score. As the residue coevolution in C-Myb should be examined, only alignment columns that have no gap in C-Myb are considered. Finally, the MI-Z-score matrix is plotted. High values indicate that the residues at the respective two positions have coevolved.
def mutual_information_zscore(alignment, n_shuffle=100):
    codes = align.get_codes(alignment).T
    alph = alignment.sequences[0].alphabet

    mi = _mutual_information(codes, alph)
    np.random.seed(0)
    random_mi = [None] * n_shuffle
    for i in range(n_shuffle):
        shuffled_codes = _shuffle(codes)
        random_mi[i] = _mutual_information(shuffled_codes, alph)
    random_mi = np.stack(random_mi)
    mean = np.mean(random_mi, axis=0)
    std = np.std(random_mi, axis=0)
    z_score = (mi - mean) / std
    return z_score

def _shuffle(codes):
    shuffled_codes = codes.copy()
    # Shuffle each alignment column
    for i in range(len(shuffled_codes)):
        np.random.shuffle(shuffled_codes[i])
    return shuffled_codes

def _mutual_information(codes, alph):
    mi = np.zeros((len(alignment), len(alignment)))
    # Iterate over all columns to choose first column
    for i in range(codes.shape[0]):
        # Iterate over all columns to choose second column
        for j in range(codes.shape[0]):
            nrows = 0
            marginal_counts_i = np.zeros(len(alph), dtype=int)
            marginal_counts_j = np.zeros(len(alph), dtype=int)
            combined_counts = np.zeros((len(alph), len(alph)), dtype=int)
            # Iterate over all symbols in both columns
            for k in range(codes.shape[1]):
                # Skip rows where either column has a gap
                if codes[i,k] != -1 and codes[j,k] != -1:
                    marginal_counts_i[codes[i,k]] += 1
                    marginal_counts_j[codes[j,k]] += 1
                    combined_counts[codes[i,k], codes[j,k]] += 1
                    nrows += 1
            marginal_probs_i = marginal_counts_i / nrows
            marginal_probs_j = marginal_counts_j / nrows
            combined_probs = combined_counts / nrows

            with warnings.catch_warnings():
                warnings.simplefilter("ignore")
                mi_before_sum = (
                    combined_probs * np.log2(
                        combined_probs / (
                            marginal_probs_i[:, np.newaxis] *
                            marginal_probs_j[np.newaxis, :]
                        )
                    )
                ).flatten()
            mi[i,j] = np.sum(mi_before_sum[~np.isnan(mi_before_sum)])
    return mi


# Remove alignment columns that have a gap in the C-Myb sequence
alignment = alignment[alignment.trace[:,0] != -1]

mi = mutual_information_zscore(alignment)

# Create the color map for the plot
color = colors.to_rgb(biotite.colors["dimorange"])
cmap_val = np.stack(
    [np.interp(np.linspace(0, 1, 100), [0, 1], [1, color[i]])
        for i in range(len(color))]
).transpose()
cmap = colors.ListedColormap(cmap_val)

# Plot the MI-Z-Score matrix
fig = plt.figure(figsize=(8.0, 7.0))
ax = fig.gca()
im = ax.pcolormesh(mi, cmap=cmap)
cbar = fig.colorbar(im)
cbar.set_label("MI-Z-score")
ax.set_aspect("equal")
ax.set_xlabel("Residue position")
ax.set_ylabel("Residue position")
ax.set_title("Residue coevolution in C-Myb R1")
fig.tight_layout()

plt.show()
/home/runner/work/biotite/biotite/doc/examples/scripts/sequence/residue_coevolution.py:127: RuntimeWarning: invalid value encountered in divide
  z_score = (mi - mean) / std
