


Note
Go to the end to download the full example code
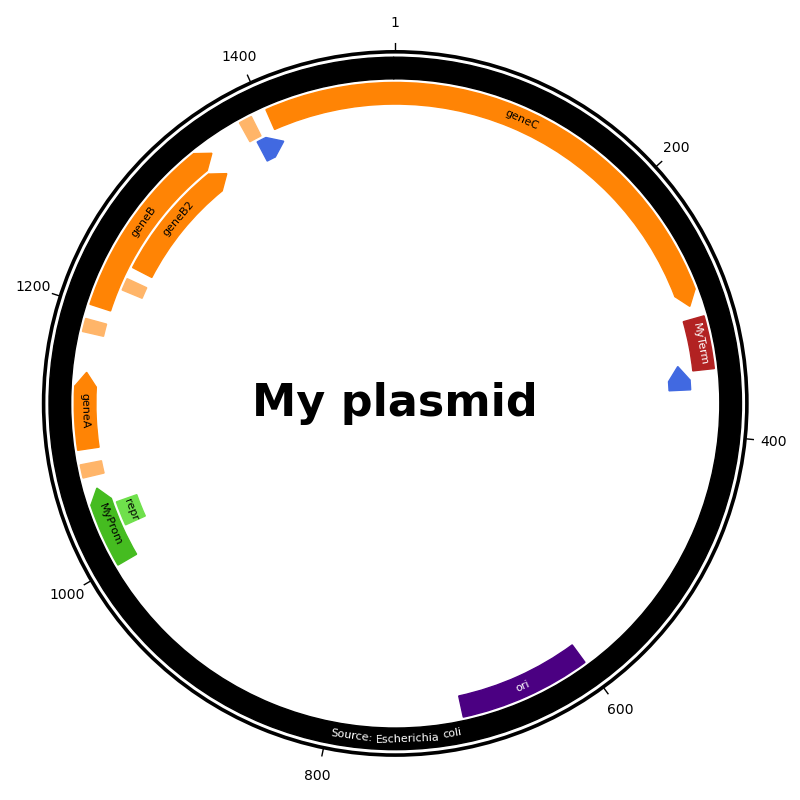
Visualization of a custom plasmid
This script shows how Feature objects are displayed in a
plasmid map by using a custom ‘toy’ Annotation.
# Code source: Patrick Kunzmann
# License: BSD 3 clause

import matplotlib.pyplot as plt
import numpy as np
import biotite.sequence as seq
import biotite.sequence.io.genbank as gb
import biotite.sequence.graphics as graphics
import biotite.database.entrez as entrez


annotation = seq.Annotation([
    seq.Feature(
        "source",
        [seq.Location(0, 1500)],
        {"organism": "Escherichia coli"}
    ),

    # Ori
    seq.Feature(
        "rep_origin",
        [seq.Location(600, 700, seq.Location.Strand.REVERSE)],
        {"regulatory_class": "promoter", "note": "MyProm"}
    ),

    # Promoter
    seq.Feature(
        "regulatory",
        [seq.Location(1000, 1060)],
        {"regulatory_class": "promoter", "note": "MyProm"}
    ),
    seq.Feature(
        "protein_bind",
        [seq.Location(1025, 1045)],
        {"note": "repr"}
    ),

    # Gene A
    seq.Feature(
        "regulatory",
        [seq.Location(1070, 1080)],
        {"regulatory_class": "ribosome_binding_site"}
    ),
    seq.Feature(
        "CDS",
        [seq.Location(1091, 1150)],
        {"product": "geneA"}
    ),

    # Gene B
    seq.Feature(
        "regulatory",
        [seq.Location(1180, 1190)],
        {"regulatory_class": "ribosome_binding_site"}
    ),
    seq.Feature(
        "CDS",
        [seq.Location(1201, 1350)],
        {"product": "geneB"}
    ),
    seq.Feature(
        "regulatory",
        [seq.Location(1220, 1230)],
        {"regulatory_class": "ribosome_binding_site"}
    ),
    seq.Feature(
        "CDS",
        [seq.Location(1240, 1350)],
        {"product": "geneB2"}
    ),

    # Gene C
    seq.Feature(
        "regulatory",
        [seq.Location(1380, 1390)],
        {"regulatory_class": "ribosome_binding_site"}
    ),
    seq.Feature(
        "CDS",
        # CDS extends over periodic boundary -> two locations
        [seq.Location(1, 300), seq.Location(1402, 1500)],
        {"product": "geneC"}
    ),

    # Terminator
    seq.Feature(
        "regulatory",
        [seq.Location(310, 350)],
        {"regulatory_class": "terminator", "note": "MyTerm"}
    ),

    # Primers
    # The labels will be too long to be displayed on the map
    # If you want to display them nevertheless, set the
    # 'omit_oversized_labels' to False
    seq.Feature(
        "primer_bind",
        [seq.Location(1385, 1405)],
        {"note": "geneC"}
    ),
    seq.Feature(
        "primer_bind",
        [seq.Location(345, 365, seq.Location.Strand.REVERSE)],
        {"note": "geneC_R"}
    ),

    # Terminator
    seq.Feature(
        "regulatory",
        [seq.Location(310, 350)],
        {"regulatory_class": "terminator", "note": "MyTerm"}
    ),
])


fig = plt.figure(figsize=(8.0, 8.0))
ax = fig.add_subplot(111, projection="polar")
graphics.plot_plasmid_map(
    ax, annotation, plasmid_size=1500, label="My plasmid",
    label_properties={"fontsize": 8}
)

ticks = ax.get_xticks()
labels = ax.get_xticklabels()

fig.tight_layout()
plt.show()
