


Note
Go to the end to download the full example code
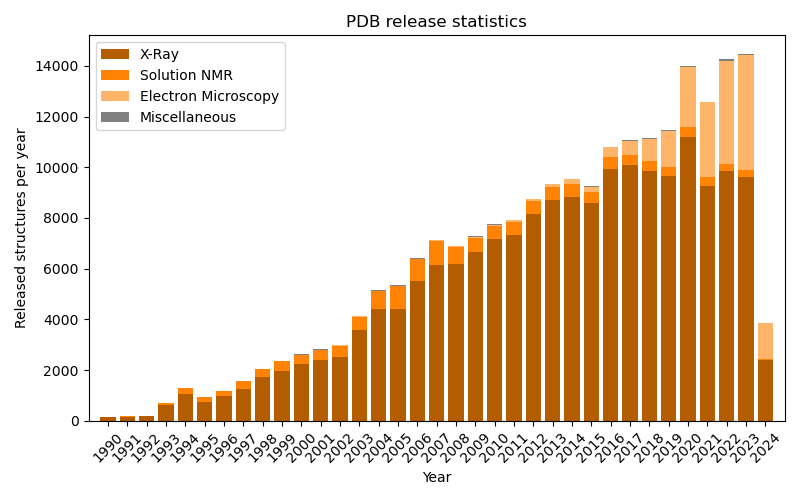
Annual releases of PDB structures
This script creates a plot showing the number of annually released PDB structures since 1990, very similar to the official statistics.
# Code source: Patrick Kunzmann
# License: BSD 3 clause

import numpy as np
import matplotlib.pyplot as plt
import biotite
import biotite.database.rcsb as rcsb
from datetime import datetime, time


years = np.arange(1990, datetime.today().year + 1)
xray_count = np.zeros(len(years), dtype=int)
nmr_count = np.zeros(len(years), dtype=int)
em_count = np.zeros(len(years), dtype=int)
tot_count = np.zeros(len(years), dtype=int)
# For each year fetch the list of released PDB IDs
# and count the number
for i, year in enumerate(years):
    # A query that comprises one year
    date_query = rcsb.FieldQuery(
        "rcsb_accession_info.initial_release_date",
        range_closed = (
            datetime.combine(datetime(year,  1,  1), time.min),
            datetime.combine(datetime(year, 12, 31), time.max)
        )
    )
    xray_query = rcsb.FieldQuery(
        "exptl.method", exact_match="X-RAY DIFFRACTION"
    )
    nmr_query = rcsb.FieldQuery(
        "exptl.method", exact_match="SOLUTION NMR"
    )
    em_query = rcsb.FieldQuery(
        "exptl.method", exact_match="ELECTRON MICROSCOPY"
    )
    # Get the amount of structures, that were released in that year
    # AND were elucidated with the respective method
    xray_count[i], nmr_count[i], em_count[i] = [
        rcsb.count(date_query & method_query)
        for method_query in [xray_query, nmr_query, em_query]
    ]
    # Get the total amount of structures released in that year
    tot_count[i] = rcsb.count(date_query)

fig, ax = plt.subplots(figsize=(8.0, 5.0))
ax.set_title("PDB release statistics")
ax.set_xlim(years[0]-1, years[-1]+1)
ax.set_xticks(years)
ax.set_xticklabels([str(y) for y in years], rotation=45)
ax.set_xlabel("Year")
ax.set_ylabel("Released structures per year")
ax.bar(
    years, xray_count,
    color=biotite.colors["darkorange"], label="X-Ray"
)
ax.bar(
    years, nmr_count, bottom=xray_count,
    color=biotite.colors["orange"], label="Solution NMR"
)
ax.bar(
    years, em_count, bottom=xray_count + nmr_count,
    color=biotite.colors["brightorange"], label="Electron Microscopy"
)
ax.bar(
    years, tot_count - xray_count - nmr_count - em_count,
    bottom=xray_count + nmr_count + em_count,
    color="gray", label="Miscellaneous"
)
ax.legend(loc="upper left")
fig.tight_layout()

plt.show()
