


Note
Go to the end to download the full example code
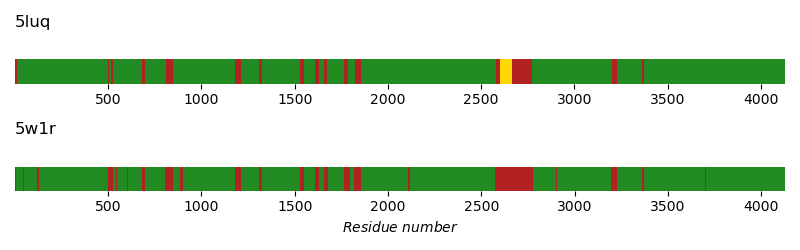
Missing residues in protein structures of DNA-PKcs
This script creates two bars, each indicating gaps in the structure of DNA-PKcs. The top bar indicates the missing residues in a recent crystal structure (PDB: 5LUQ), the bottom bar indicates missing residues in a recent cryo-EM structure (PDB: 5W1R).
Green: Space-resolved residues
Yellow: Residues with merely polyalanine annotation
Red: Unresolved residues
# Code source: Patrick Kunzmann
# License: BSD 3 clause

from tempfile import gettempdir
import biotite.structure.io as strucio
import biotite.database.rcsb as rcsb
import matplotlib.pyplot as plt
from matplotlib.patches import Rectangle
import numpy as np

def plot_gaps(pdb_id, chain_id, ax):
    # Download and parse structure file
    path = rcsb.fetch(pdb_id, "bcif", gettempdir())
    atom_array = strucio.load_structure(path)
    # Consider only one chain
    atom_array = atom_array[atom_array.chain_id == chain_id]
    # Array for saving the 'green', 'yellow' and 'red' state
    states = np.zeros(atom_array.res_id[-1], dtype=int)
    for i in range(len(states)):
        # Get array for only one residue ID
        residue = atom_array[atom_array.res_id == i+1]
        if len(residue) == 0:
            # not existing
            states[i] = 0
        elif residue.res_name[0] == "UNK":
            # exisiting but polyalanine
            states[i] = 1
        else:
            # existing
            states[i] = 2

    # Find the intervals for each state
    state_intervals = []
    curr_state = None
    curr_start = None
    for i in range(len(states)):
        if curr_start is None:
            curr_start = i
            curr_state = states[i]
        else:
            if states[i] != states[i-1]:
                state_intervals.append((curr_start, i, curr_state))
                curr_start = i
                curr_state = states[i]
    state_intervals.append((curr_start, i, curr_state))

    # Draw the state intervals as colored rectangles
    for interval in state_intervals:
        start = interval[0]
        stop = interval[1]
        state = interval[2]
        if state == 0:
            color = "firebrick"
        elif state == 1:
            color = "gold"
        elif state == 2:
            color = "forestgreen"
        ax.add_patch(Rectangle((start+1-0.5, 0), stop-start, 1,
                                edgecolor="None", facecolor=color))
    # Some other visual stuff
    ax.spines["left"].set_visible(False)
    ax.spines["bottom"].set_visible(False)
    ax.spines["right"].set_visible(False)
    ax.spines["top"].set_visible(False)
    ax.yaxis.set_visible(False)
    ax.set_xlim(0.5, len(states) + 0.5)
    ax.set_ylim(0, 2)


fig = plt.figure(figsize=(8.0, 2.5))
ax = fig.add_subplot(211)
ax.set_title("5luq", loc="left")
plot_gaps("5luq", "A", ax)
ax = fig.add_subplot(212)
ax.set_title("5w1r", loc="left")
plot_gaps("5w1r", "A", ax)
ax.set_xlabel("$Residue \ number$")
fig.tight_layout()
plt.show()
