


Note
Go to the end to download the full example code
Plot epitope mapping data onto protein sequence alignments
Peptide arrays can be used as a high-throughput platform for screening biological interactions. Typical screenings involve the immobilization of diverse peptides on a solid surface to study their interactions with various target molecules. Specifically, arrays of peptides with overlapping sequences can be used to identify the epitope of antibodies on a protein antigen at amino acid level.
General scannings for molecular recognition using peptide arrays
are particlularly useful for epitope identification on monoclonal
antibodies. This example visualizes the data from two epitope mapping
studies, using a color coded sequence alignment representation
of the antigens screened. The scannings interrogated a monoclonal
antibody (MAb) against two arrays of overlaping peptides 1.
The files containing peptide array data can be downloaded
here
and
here.
The antigens screened span the extracellular domain of VAR2CSA, a
virulence factor of Plasmodiun falciparum for the strains FCR3
(residues 1-2659) and NF54 (residues 1-2652). The sequence of
the two domains can be downloaded
here.
First, we generate a sequence aligment of the two VAR2CSA strains:
# Code source: Daniel Ferrer-Vinals
# License: BSD 3 clause
import matplotlib as mpl
import matplotlib.pyplot as plt
import numpy as np
import pandas as pd
import biotite.sequence as seq
import biotite.sequence.align as align
import biotite.sequence.graphics as graphics
import biotite.sequence.io.fasta as fasta

# Path to the data files
array_seq_path = "../../download/Array_Seq.txt"

fasta_file = fasta.FastaFile.read(array_seq_path)

# Parse protein sequences of FCR3 and NF54
for name, sequence in fasta_file.items():
    if "AAQ73926" in name:
        fcr3_seq = seq.ProteinSequence(sequence)
    elif "EWC87419" in name:
        nf54_seq = seq.ProteinSequence(sequence)

# Get BLOSUM62 matrix
matrix = align.SubstitutionMatrix.std_protein_matrix()
# Perform pairwise sequence alignment
alignments = align.align_optimal(fcr3_seq, nf54_seq, matrix,
                                 gap_penalty = (-10, -1),
                                 terminal_penalty = False)

alignment = alignments[0]
print(alignment)
GSGSGSGMDSTSTIANKIEEYLGAKSDDSKIDELLKADPSEVEYYRSGGDGDYLKNNICKITVNHSDSGK
GSGSGSGMDKSS-IANKIEAYLGAKSDDSKIDQSLKADPSEVQYYGSGGDGYYLRKNICKITVNHSDSGT

YDPCEKKLPPYDDNDQWKCQQNSSDGSGKPENICVPPRRERLCTYNLENLKFDKIRDNNAFLADVLLTAR
NDPCDRIPPPYGDNDQWKCAIILSKVSEKPENVFVPPRRQRMCINNLEKLNVDKIRDKHAFLADVLLTAR

NEGEKIVQNHPDTNSSNVCNALERSFADLADIIRGTDQWKGTNSNLEKNLKQMFAKIRENDKVLQDKYPK
NEGERIVQNHPDTNSSNVCNALERSFADIADIIRGTDLWKGTNSNLEQNLKQMFAKIRENDKVLQDKYPK

DQKYTKLREAWWNANRQKVWEVITCGARSNDLLIKRGWRTSGKSDRKKNFELCRKCGHYEKEVPTKLDYV
DQNYRKLREDWWNANRQKVWEVITCGARSNDLLIKRGWRTSGKSNGDNKLELCRKCGHYEEKVPTKLDYV

PQFLRWLTEWIEDFYREKQNLIDDMERHREECTREDHKSKEGTSYCSTCKDKCKKYCECVKKWKTEWENQ
PQFLRWLTEWIEDFYREKQNLIDDMERHREECTSEDHKSKEGTSYCSTCKDKCKKYCECVKKWKSEWENQ

ENKYKDLYEQNKNKTSQKNTSRYDDYVKDFFEKLEANYSSLENYIKGDPYFAEYATKLSFILNPSDANNP
KNKYTELYQQNKNETSQKNTSRYDDYVKDFFKKLEANYSSLENYIKGDPYFAEYATKLSFILNSSDANNP

SGETANHNDEACNCNESGISSVGQAQTSGPSSNKTCITHSSIKTNKKKECKDVKLGVRENDKDLKICVIE
SEKIQKNNDEVCNCNESGIASVEQEQISDPSSNKTCITHSSIKANKKKVCKHVKLGVRENDKDLRVCVIE

DTSLSGVDNCCCQDLLGILQENCSDNKRGSSSNDSCDNKNQDECQKKLEKVFASLTNGYKCDKCKSGTSR
HTSLSGVENCCCQDFLRILQENCSDNKSGSSSNGSCNNKNQEACEKNLEKVLASLTNCYKCDKCKSEQSK

-SKKKWIWKKSSGNEEGLQEEYANTIGLPPRTQSLYLGN-LPKLENVCEDVKDINFDTKEKFLAGCLIVS
KNNKNWIWKKSSGKEGGLQKEYANTIGLPPRTQSLCLVVCLDEKGKKTQELKNIR--TNSELLKEWIIAA

FHEGKNLKKRYPQNKNSGNKENLCKALEYSFADYGDLIKGTSIWDNEYTKDLELNLQNNFGKLFGKYIKK
FHEGKNLKPSH-EKKNDDNGKKLCKALEYSFADYGDLIKGTSIWDNEYTKDLELNLQKIFGKLFRKYIKK

NNTAEQDTSYSSLDELRESWWNTNKKYIWTAMKHGAEMNITTCNADGSVTGSGSSCDDIPTIDLIPQYLR
NNTAEQDTSYSSLDELRESWWNTNKKYIWLAMKHGAGMNSTTCCGDGSVTGSGSSCDDIPTIDLIPQYLR

FLQEWVENFCEQRQAKVKDVITNCKSCKESGNKCKTECKTKCKDECEKYKKFIEACGTAGGGIGTAGSPW
FLQEWVEHFCKQRQEKVKPVIENCKSCKESGGTCNGECKTECKNKCEVYKKFIEDCK---GGDGTAGSSW

SKRWDQIYKRYSKHIEDAKRNRKAGTKNCGTSSTTNAAASTDENKCVQSDIDSFFKHLIDIGLTTPSSYL
VKRWDQIYKRYSKYIEDAKRNRKAGTKNCGPSSTTNAA----ENKCVQSDIDSFFKHLIDIGLTTPSSYL

SNVLDDNICGADKAPWTTYTTYTTTEKCNKERDKSKSQSSDTLVVVNVPSPLGNTPYRYKYACQCKIPTN
SIVLDDNICGADKAPWTTYTTYTTTEKCNKETDKSKLQQCNTAVVVNVPSPLGNTPHGYKYACQCKIPTN

EETCDDRKEYMNQWSCGSARTMKRGYKNDNYELCKYNGVDVKPTTVRSNSSKLDGNDVTFFNLFEQWNKE
EETCDDRKEYMNQWSCGSARTMKRGYKNDNYELCKYNGVDVKPTTVRSNSSKLDDKDVTFFNLFEQWNKE

IQYQIEQYMTNANISCIDEKEVLDSVSDEGT-PKVRGGYEDGRNNNTDQGTNCKEKCKCYKLWIEKINDQ
IQYQIEQYMTNTKISCNNEKNVLSRVSDEAAQPKFSDNERD-RNSITHEDKNCKEKCKCYSLWIEKINDQ

WGKQKDNYNKFRSKQIYDANKGSQNKKVVSLSNFLFFSCWEEYIQKYFNGDWSKIKNIGSDTFEFLIKKC
WDKQKDNYNKFQRKQIYDANKGSQNKKVVSLSNFLFFSCWEEYIQKYFNGDWSKIKNIGSDTFEFLIKKC

GNNSAHGEEIFNEKLKNAEKKCKENESTDTNINKSETSCDLNATNYIRGCQSKTYDGKIFPGKGGEKQWI
GNDSGDGETIFSEKLNNAEKKCKENESTNNKMKSSETSCDCSEPIYIRGCQPKIYDGKIFPGKGGEKQWI

CKDTIIHGDTNGACIPPRTQNLCVGELWDKSYGGRSNIKNDTKELLKEKIKNAIHKETELLYEYHDTGTA
CKDTIIHGDTNGACIPPRTQNLCVGELWDKRYGGRSNIKNDTKESLKQKIKNAIQKETELLYEYHDKGTA

IISKNDKKGQKGK----NDPNGLPKGFCHAVQRSFIDYKNMILGTSVNIYEHIGKLQEDIKKIIEKGTPQ
IISRNPMKGQKEKEEKNNDSNGLPKGFCHAVQRSFIDYKNMILGTSVNIYEYIGKLQEDIKKIIEKGTTK

QKDKIGGVGSSTENVNAWWKGIEREMWDAVRCAITKINKKNN-NSIFNGDECGVSPPTGNDEDQSVSWFK
QNGKT--VGSGAENVNAWWKGIEGEMWDAVRCAITKINKKQKKNGTFSIDECGIFPPTGNDEDQSVSWFK

EWGEQFCIERLRYEQNIREACTINGKNEKKCINSKSGQGDKIQGACKRKCEKYKKYISEKKQEWDKQKTK
EWSEQFCIERLQYEKNIRDACTNNG------------QGDKIQGDCKRKCEEYKKYISEKKQEWDKQKTK

YENKYVGKSASDLLKENYPECISANFDFIFNDNIEYKTYYPYGDYSSICSCEQVKYYKYNNAEKKNNKSL
YENKYVGKSASDLLKENYPECISANFDFIFNDNIEYKTYYPYGDYSSICSCEQVKYYEYNNAEKKNNKSL

CYEKDNDMTWSKKYIKKLENGRSLEGVYVPPRRQQLCLYELFPIIIKNEEGMEKAKEELLETLQIVAERE
CHEKGNDRTWSKKYIKKLENGRTLEGVYVPPRRQQLCLYELFPIIIKNKNDITNAKKELLETLQIVAERE

AYYLWKQYNPTGKGIDDANKKACCAIRGSFYDLEDIIKGNDLVHDEYTKYIDSKLNEIFGSSDTNDIDTK
AYYLWKQYHAHNDTTYLAHKKACCAIRGSFYDLEDIIKGNDLVHDEYTKYIDSKLNEIFDSSNKNDIETK

RARTDWWENETIT-------NGTDRKTIRQLVWDAMQSGVRYAVEEK------NENFPLCMGVEHIGIAK
RARTDWWENEAIAVPNITGANKSDPKTIRQLVWDAMQSGVRKAIDEEKEKKKPNENFPPCMGVQHIGIAK

PQFIRWLEEWTNEFCEKYTKYFEDMKSKCDPPKRADTCGDNSNIECKKACANYTNWLNPKRIEWNGMSNY
PQFIRWLEEWTNEFCEKYTKYFEDMKSNCNLRKGADDCDDNSNIECKKACANYTNWLNPKRIEWNGMSNY

YNKIYRKSNKESEGGKDYSMIMAPTVIDYLNKRCHGEINGNYICCSCKNIGAYNTTSGTVNKKLQKKETE
YNKIYRKSNKESEDGKDYSMIMEPTVIDYLNKRCNGEINGNYICCSCKNIGE-NSTSGTVNKKLQKKETQ

CEEEKGPLDLMNEVLNKMDKKYSAHKMKCTEVYLEHVEEQLNEIDNAIKDYKLYPLDRCFDDQTKMKVCD
CEDNKGPLDLMNKVLNKMDPKYSEHKMKCTEVYLEHVEEQLKEIDNAIKDYKLYPLDRCFDDKSKMKVCD

LIADAIGCKDKTKLDELDEWNDMDLRGTYNKHKGVLIPPRRRQLCFSRIVRGPANLRSLNEFKEEILKGA
LIGDAIGCKHKTKLDELDEWNDVDMRDPYNKYKGVLIPPRRRQLCFSRIVRGPANLRNLKEFKEEILKGA

QSEGKFLGNYYKEHKDKEKALEAMKNSFYDYEDIIKGTDMLTNIEFKDIKIKLDRLLEKETNNTKKAEDW
QSEGKFLGNYYNEDKDKEKALEAMKNSFYDYEYIIKGSDMLTNIQFKDIKRKLDRLLEKETNNTEKVDDW

WKTNKKSIWNAMLCGYKKSGNKIIDPSWCTIPTTETPPQFLRWIKEWGTNVCIQKQEHKEYVKSKCSNVT
WETNKKSIWNAMLCGYKKSGNKIIDPSWCTIPTTETPPQFLRWIKEWGTNVCIQKEEHKEYVKSKCSNVT

NLGAQASESNNCTSEIKKYQEWSRKRSIRWETISKRYKKYKRMD----ILKDVKEPDANT-----YLREH
NLGAQESESKNCTSEIKKYQEWSRKRSIQWEAISEGYKKYKGMDEFKNTFKNIKEPDANEPNANEYLKKH

CSKCPCGFNDMEEMNNNEDNEKEAFKQIKEQVKIPAELEDVIYRIKHHEYDKGNDYICNKYKNIHDRMKK
CSKCPCGFNDMQEITKYTNIGNEAFKQIKEQVDIPAELEDVIYRLKHHEYDKGNDYICNKYKNINVNMKK

NNGNFVTDNFVKKSWEISNGVLIPPRRKNLFLYIDPSKICEYKKDPKLFKDFIYWSAFTEVERLKKAYGG
NNDDTWTD-LVKNSSDINKGVLLPPRRKNLFLKIDESDICKYKRDPKLFKDFIYSSAISEVERLKKVYGE

ARAKVVHAMKYSFTDIGSIIKGDDMMEKNSSDKIGKILGDTDGQNEKRKKWWDMNKYHIWESMLCGYREA
AKTKVVHAMKYSFADIGSIIKGDDMMENNSSDKIGKILGDGVGQNEKRKKWWDMNKYHIWESMLCGYKHA

EGDTETNEN--CRFPDIESVPQFLRWFQEWSENFCDRRQKLYDKLNSECISAEC--TNGSVDNSKCTHAC
YGNISENDRKMLDIPNNDDEHQFLRWFQEWTENFCTKRNELYENMVTACNSAKCNTSNGSVDKKECTEAC

VNYKNYILTKKTEYEIQTNKYDNEFKNKNSNDKDAPDYLKEKCNDNKCECLNKHIDDKNKTWKNPYETLE
KNYSNFILIKKKEYQSLNSQYDMNYKETKAEKKESPEYFKDKCN-GECSCLSEYFKDETR-WKNPYETLD

DT-FKSKCDCPKPLPSPIKPDDLPPQADEPFDPTILQTTIPGSGSGSG
DTEVKNNCMCKPP----------PPASNNTSD--ILQKTIPGSGSGSG
Epitope mapping data
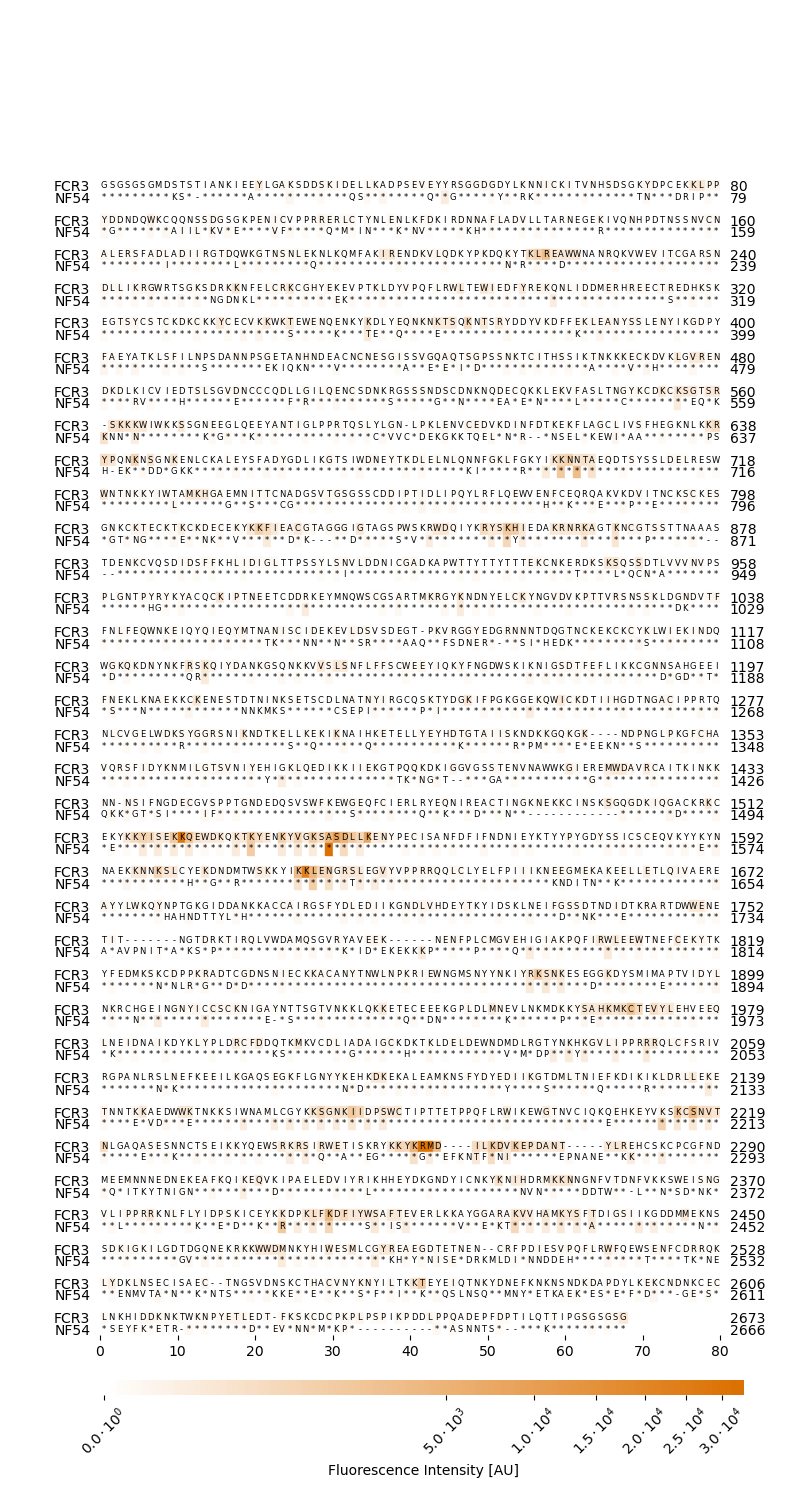
This study used arrays of overlaping peptides to achive high acurracy in mapping the epitope. Both FCR3 and NF54 arrays, consisted of 20-mer peptides with an overlap of 19 and 18 amino acids respectively. Arbitrary units (AU) of fluorescence intensity quantified the antibody recognition for each peptide. Our goal is to decorate the aligment, with the fluorescence intensity scores of each peptide in the arrays. We used a color code from red to white for high to low intensity, respectively. The background color of the symbols on the aligment corresponds to the score for the 20th amino acid at the end of the peptide.
Lets create a function that maps the peptide score to the 20th residue of the peptide:
def read_scan(filename, pep_len=20, score_res=20):
    if not type(pep_len) is int:
        raise TypeError("pep_len : only integers are allowed")
    elif not type(score_res) is int:
         raise TypeError("score_res : only integers are allowed")
    elif pep_len < score_res:
        raise Exception("score_res can't be higher than pep_len")

    elif pep_len != 20 or score_res != 20:
        s = (score_res) - pep_len -1
    else:
        s =-1

    df= pd.read_csv(filename)
    scor_res = df['Seq'].str[s]
    df['s_res'] = scor_res

    return df

# Load epitope scan data
fcr3_file_path  = "../../download/FCR3_10ug.csv"
nf54_file_path  = "../../download/NF54_10ug.csv"

# Define the score residues on the arrays
files = [fcr3_file_path, nf54_file_path]
d = 0
for f in files:
    if f == files[0]:
        ag1_scan = read_scan(files[d], 20, 20)
    elif f == files[1]:
        ag2_scan = read_scan(files[d], 20, 20)
    d = d + 1
ag1_scan.head(5)
The microarrays contained each peptide printed in duplicated spots. We need to combine the values of those experimental replicates into a unique score for each peptide. Typically, this unique value could come from the geometric mean between replicates that do not deviate wildly. If the average deviation between replicates is high, one can assumme that experimental errors should result in a lower score at a given spot. It is easy to imagine that imperfections on the printing of the spot, will rather decrease and not increase, the antibody recognition, in which case the the peptide signal is better represented by the higher score replicate.
Now lets write a function to combine the scores adding the flexibility to choose cases for those criterias exposed above. We will flag with 0 or 1 every peptide entry on the arrays: 1 if the deviation between replicates is higher than 40%, otherwise 0.
def combine_scores(dataframe, combine='max', flag_noisy=True):
    df= dataframe
    # mean
    df['ave'] = df.iloc[:,[1,2]].mean(axis = 1)
    # mean deviation
    df['avedev'] = ((df.r1 - df.ave).abs() + (df.r2 - df.ave).abs()) / 2
    # percent deviation between replicates
    df['dev_ratio'] = df.apply(lambda x:0
                               if x.avedev==0 else x.avedev/x.ave, axis=1)

    # signal value:
    if combine == 'max':
        df['comb_signal'] = df.apply(lambda x:max(x.r1, x.r2)
                                     if x.dev_ratio >=0.4 else x.ave, axis=1)
    elif combine == 'mean':
        df['comb_signal'] = df.apply(lambda x:x.ave
                                     if x.dev_ratio <= 0.4 else 0, axis=1)

    if flag_noisy:
        df['flag'] = df.apply(lambda x:0
                              if x.dev_ratio <= 0.4 else 1, axis=1)
    return df

# Make the corresponding signal equal the replicate with the higest
# score value.
dfa = combine_scores(ag1_scan, combine = 'max', flag_noisy = True)
dfb = combine_scores(ag2_scan, combine = 'max', flag_noisy = True)
dfa.head(5)
Many molecular recognition screening campaings e.g. epitope mapping screenings follow a long-tailed data distribution. To properly represent such distribution one can normalize the date using linear or non-linear transformations on the combined score data.
def data_transform(dataframe, threshold=0):
    df = dataframe
    # Option to set a "threshold" for the signal scores.
    t = threshold

    df['cubic'] = df.apply(lambda x: np.cbrt(max(0, x.comb_signal-t)),
                               axis=1)
    df['signal_plot'] = df.apply(lambda x: x.cubic/df['cubic'].max(),
                                     axis=1)

# Normalize, using the power law with cubic exponent. No threshold
data_transform(dfa, threshold=0)
data_transform(dfb, threshold=0)
dfa.head(5)
Convert score residues from the epitope scan to alignment-like gapped sequences
So far, we have the peptide score data combined, normalized, and mapped to a residue for each peptide. Next, using the alignment trace as a template, we will match the signal intensities associated to the score residues, to the position of each symbol on the alignment, considering the gaps.
# Get the trace for each sequence on the alignment:
trace_a = align.get_symbols(alignment)[0]
trace_b = align.get_symbols(alignment)[1]

def gapped_seq(dataframe, seq_trace, p_len, overlap_step=1):
    """
    Generate a gapped sequence that relates peptide score data signal with a
    template alignment trace. The function returns a list of tuples representing
    the gapped sequence, where each tuple consists of a residue and its associated
    signal value.

    Parameters
    ----------
    dataframe : DataFrame
        A *Pandas* dataframe containing columns for each peptide score data,
        and its designated score residue.
    seq_trace : list
        The sequence trace obtained from the alignment.
    p_len : int
        The length of each overlapping peptide.
    overlap_step : int, optional
        The step size for overlapping peptides.Default is 1.

    Note:
    -----
    The 'gapped' sequence may be shorter than the aligment trace if the alignment results
    in gaps at either end. Any remaining elements in the trace with 'None' values are
    filled with tuples: ('None', 0).
    """
    template = seq_trace
    df = dataframe
    step = overlap_step
    gapped = list(zip(df.s_res , df.signal_plot))
    lk1 =  df["s_res"].values.tolist()
    plen = p_len        # peptide length

    if step == 1:
        x, b = 0, 0
        c = 0            # cyclic counter up to the peptide length :20
        p = 0            # peptide counter
        for b in range(len(lk1)):
            for a in template[x:]:
                if c < plen-1 :
                    if a==None:
                        gapped.insert(x,(template[x],0))
                        x=x+1
                    elif a != lk1[b]:
                        gapped.insert(x,(template[x],0))
                        x=x+1
                        c=c+1
                    elif p==0:
                        gapped.insert(x,(template[x],0))
                        x=x+1
                        c=c+1
                    else:
                        x=x+1
                        c=c+1
                        break
                else:
                    c = 0 # reset the counter
                    p=p+1
                    x=x+1
                    break

    elif step == 2:
        x, b = 0, 0
        c=0
        p=0
        for b in range(len(lk1)):
            for a in template[x:]:
                if c < plen-1 and p==0:
                    if a==None:
                        gapped.insert(x,(template[x],0))
                        x=x+1
                    else:
                        gapped.insert(x,(template[x],0))
                        x=x+1
                        c=c+1
                elif p==0 :
                    c = 0 # reset the counter
                    p=p+1
                    x=x+1
                    break
                if p!=0:
                    if a==None and c == 0:
                        gapped.insert(x,(template[x],0))
                        x=x+1
                    elif c % 2 == 0:
                        if a==None:
                            gapped.insert(x,(template[x],0))
                            x=x+1
                        else:
                            gapped.insert(x,(template[x],0))
                            x=x+1
                            c=c+1
                    elif c % 2 != 0:
                        if a==None:
                            gapped.insert(x,(template[x],0))
                            x=x+1
                        elif a != lk1[b]:
                            gapped.insert(x,(template[x],0))
                            x=x+1
                            c=c+1
                        else:
                            x=x+1
                            c=c+1
                            break

    # For terminal gaps
    if len(gapped) < len(template) and template[len(gapped)+1]== None:
        gapped_tail=[]
        for n in range(len(template)-len(gapped)):
            gapped_tail.append(('None', 0))
        gapped = gapped + gapped_tail

    return gapped

# Let's use gapped_seq() to build the gapped sequences
# FCR3 array, overlap_step: 1 (pep = 20-mer with 19 overlap)
gapd_s1 = gapped_seq(dfa, trace_a, 20, 1)

# NF54 array, overlap_step: 2 (pep = 20-mer with 18 overlap)
gapd_s2 = gapped_seq(dfb, trace_b, 20, 2)

# Checkpoint. Both gapped sequences must have the same length.
len(gapd_s1) == len(gapd_s2)
True
Create a signal map
Now we will generate an object mapping the signal scores from two gapped sequences.
def signal_map(gapped_seq1, gapped_seq2,):
    """
    Generate a mapping of signal scores from two gapped sequences.
    This function takes two gapped sequences, `gapped_seq1` and
    `gapped_seq2`. Each sequence is represented as a list of tuples,
    with the first element being an amino acid symbol and the second
    element being a signal score. It extracts the signal scores from
    each sequence and creates a 2D array with two columns, where the
    first column contains signal scores from `gapped_seq1` and the
    second column contains signal scores from `gapped_seq2`.

    Parameters:
    -----------
    gapped_seq1: list
        The first gapped sequence.
    gapped_seq2: list
        The second gapped sequence.

    Returns:
    --------
    numpy.ndarray: A 2D numpy array with two columns containing signal
                   scores extracted from `gapped_seq1` and `gapped_seq2`
                   respectively.
    """
    gapd_s1 = gapped_seq1
    gapd_s2 = gapped_seq2
    fl_score = np.zeros((len(gapd_s1),2))

    for v1 in range(len(gapd_s1)):
        fl_score[v1,0] = gapd_s1[v1][1]
        fl_score[v1,1] = gapd_s2[v1][1]

    return fl_score

score = signal_map(gapd_s1, gapd_s2)
Sequence alignment decorated with MAb recognition regions
Now we can plot the sequence alignment using an ArrayPlotter
instance that higlights sequence recognition regions at the positions
of the respective score residue per alignment column.
To easily interpret the intensity-decorated alignment we will add a
colorbar scaled accordingly. The scale matches the transformation
applied to the recognition signal recorded on the score ndarray.
Let’s build a function to create a custom colorbar object. We will specify the dataframes corresponding to the two antigens screened in this example, the colormap, and the transformation to be represented with the colorbar.
fig = plt.figure(figsize=(8.0, 15))
ax = fig.add_subplot(111)
graphics.plot_alignment_array(
    ax, alignments[0], fl_score=score, labels=["FCR3", "NF54"],
    show_numbers=True, symbols_per_line=80,
    show_line_position=True, label_size=10,
    number_size=10, symbol_size=6)

# Add the axes where the colorbar will reside:
ax2 = fig.add_axes([0.13, 0.07, 0.8, 0.01])
ax2.set_frame_on(False)

# Access the colormap of the relevant instace of ArrayPlotter:
colormap = graphics.ArrayPlotter(ax2, score).get_cmap()

def draw_colorbar(axes, array1, array2, colormap,
                 orient=None, title=None):
    df1 = array1
    df2 = array2
    cmp = colormap
    ax = axes
    orientation = orient
    label = title

    # custom Formtatter for tick labels on the colorbar
    def fmt(x, pos):
        a, b = '{:.1e}'.format(x).split('e')
        b = int(b)
        return r'${}\cdot10^{{{}}}$'.format(a, b)

    vmiA = df1['comb_signal'].min()
    vmiB = df2['comb_signal'].min()
    vmxA = df1['comb_signal'].max()
    vmxB = df2['comb_signal'].max()

   # The normalization of this colormap needs to be consistent with the
   # data trasnformtion used earlier on this example. The "cubic" law:
    norm = mpl.colors.PowerNorm(gamma=0.33, vmin=min(vmiA,vmiB),
                                vmax=max(vmxA,vmxB))

    fig = mpl.pyplot.figure()
    return fig.colorbar(mpl.cm.ScalarMappable(norm=norm, cmap=cmp),
                 cax=ax, orientation=orientation, label=label,
                 format=mpl.ticker.FuncFormatter(fmt))

# Draw the colorbar
cbar = draw_colorbar(ax2, dfa, dfb, colormap, orient='horizontal',
                       title='Fluorescence Intensity [AU]')

# To improve readability we tilt the ticklabels on the colorbar
labels = cbar.ax.get_xticklabels()
plt.setp(labels, rotation=45, horizontalalignment='center')
plt.show()

References
- 1
U. Iyamu, D. F. Vinals, B. Tornyigah, E. Arango, R. Bhat, T. R. Adra, S. Grewal, K. Martin, A. Maestre, M. Overduin, B. Hazes, S. K. Yanow, “A conserved epitope in VAR2CSA is targeted by a cross-reactive antibody originating from Plasmodium vivax Duffy binding protein,” Frontiers in Cellular and Infection Microbiology, vol. 13, 2023.
