biotite.structure.graphics.plot_ball_and_stick_model
- biotite.structure.graphics.plot_ball_and_stick_model(axes, atoms, colors, ball_size=200, line_color='black', line_width=1.0, background_color=None, center=None, size=None, zoom=1.0)[source]
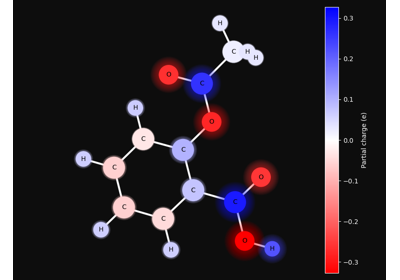
Plot an
AtomArrayas ball-and-stick model.The z-axis points into the screen plane.
UNSTABLE: This function is probably subject to future changes.
- Parameters
- axesAxes3D
The Matplotlib 3D-axes to plot the structure on.
- atomsAtomArray, length=n
The structure to be plotted. The atom array must have an associated
BondList, i.e. itsbondsattribute must be defined. One line for each bond is drawn.- colorsndarray, shape=(n,3) or shape=(n,4), dtype=float
An array of RGB or RGBA colors for each atom in atoms, that is used to color the balls of the model. The values for each color channel are in the range 0 to 1.
- ball_sizeint or iterable of int, shape=(n,)
The size of the balls in the model in pt. Either a single value for all atoms or an iterable object of values for each atom.
- line_colorobject
A Matplotlib compatible color value for the sticks of the model.
- line_widthfloat, optional
The width of the sticks in the model in pt.
- background_colorobject
A Matplotlib compatible color (color name or RGB values). If set, the background is colored with the given value.
- centertuple of (float, float, float), optional
The coordinates of the structure that are in the center of the plot. By default the complete molecule is centered.
- sizefloat, optional
The size of each dimension in the plot. The limits of the
Axes3Dare set to(center - size/(2*zoom)), (center + size/(2*zoom)).- zoomfloat, optional
Zoom in or zoom out.
> 1.0: Zoom in.< 1.0: Zoom out.
Notes
This is a very simple visualization tools for quick visual analysis of a structure. For publication-ready molecular images the usage of a dedicated molecular visualization tool is recommended.