


Note
Go to the end to download the full example code
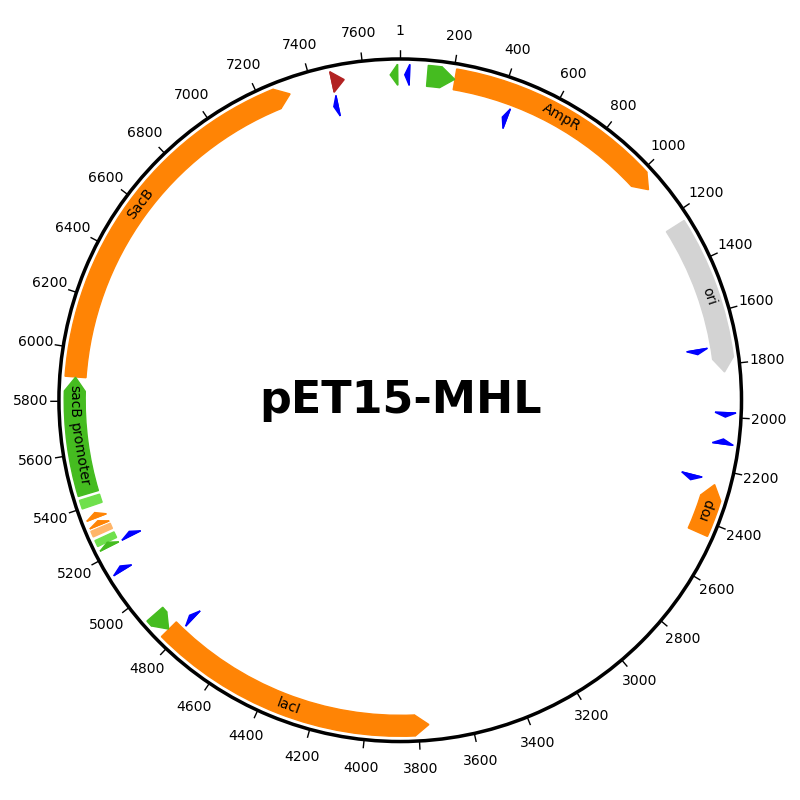
Plasmid map of a pET15 vector
This script downloads the GenBank file for a pET15 plasmid from AddGene and draws a plasmid map using a custom feature formatter.
Promoters - green arrow
Terminators - red arrow
Protein binding sites - light green rectangle
RBS - light orange rectangle
CDS - orange arrow
Ori - gray arrow
Primer - blue arrow
# Code source: Patrick Kunzmann
# License: BSD 3 clause

import io
import requests
import matplotlib.pyplot as plt
import numpy as np
import biotite
import biotite.sequence.io.genbank as gb
import biotite.sequence.graphics as graphics
import biotite.database.entrez as entrez


PLASMID_URL = "https://media.addgene.org/snapgene-media/v1.7.9-0-g88a3305/"\
              "sequences/12250/9998fdbe-051f-4dc6-ba0f-24e65127a0c5/" \
              "addgene-plasmid-26092-sequence-12250.gbk"


response = requests.get(PLASMID_URL)
gb_file = gb.GenBankFile.read(io.StringIO(response.text))
annotation = gb.get_annotation(gb_file, include_only=[
    "promoter", "terminator", "protein_bind",
    "RBS", "CDS", "rep_origin", "primer_bind"
])
_, seq_length, _, _, _, _ = gb.get_locus(gb_file)
# AddGene stores the plasmid name in the 'KEYWORDS' field
# [0][0][0] ->
# The first (and only) 'KEYWORDS' field
# The first entry in the tuple
# The first (and only) line in the field
plasmid_name = gb_file.get_fields("KEYWORDS")[0][0][0]


def custom_feature_formatter(feature):
    # AddGene stores the feature label in the '\label' qualifier
    label = feature.qual.get("label")
    if feature.key == "promoter":
        return True, biotite.colors["dimgreen"], "black", label
    elif feature.key == "terminator":
        return True, "firebrick", "black", label
    elif feature.key == "protein_bind":
        return False, biotite.colors["lightgreen"], "black", label
    elif feature.key == "RBS":
        return False, biotite.colors["brightorange"], "black", label
    elif feature.key == "CDS":
        return True, biotite.colors["orange"], "black", label
    elif feature.key == "rep_origin":
        return True, "lightgray", "black", label
    elif feature.key == "primer_bind":
        return True, "blue", "black", label


fig = plt.figure(figsize=(8.0, 8.0))
ax = fig.add_subplot(111, projection="polar")
graphics.plot_plasmid_map(
    ax, annotation, plasmid_size=seq_length,
    label=plasmid_name, feature_formatter=custom_feature_formatter
)
fig.tight_layout()
plt.show()
