


Note
Go to the end to download the full example code
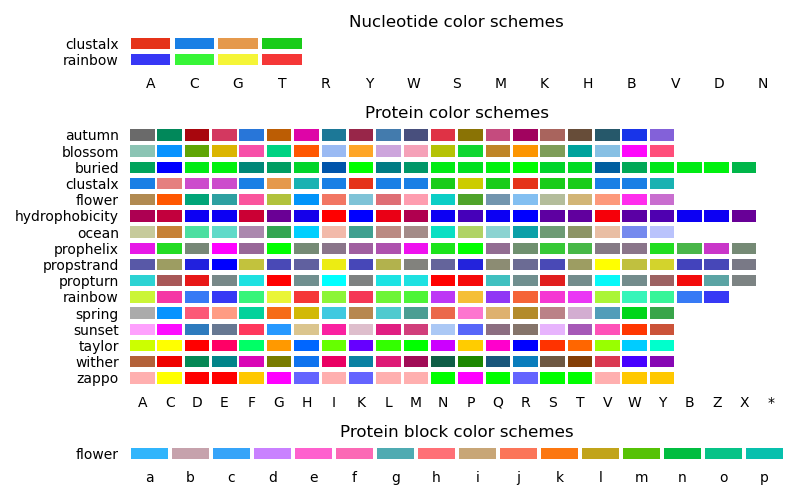
Biotite color schemes
This script displays the available color schemes.
# Code source: Patrick Kunzmann
# License: BSD 3 clause

import biotite.sequence as seq
import biotite.sequence.graphics as graphics
import numpy as np
import matplotlib.pyplot as plt
from matplotlib.gridspec import GridSpec
from matplotlib.patches import Rectangle

def plot_colors(ax, alphabet):
    x_space=0.1
    y_space=0.3
    scheme_names = sorted(graphics.list_color_scheme_names(alphabet))
    scheme_names.reverse()
    schemes = [graphics.get_color_scheme(name, alphabet)
               for name in scheme_names]
    for i, scheme in enumerate(schemes):
        for j, color in enumerate(scheme):
            box = Rectangle((j - 0.5 + x_space/2, i - 0.5 + y_space/2),
                            1 - x_space, 1 - y_space, color=color,
                            linewidth=0)
            ax.add_patch(box)
    ax.set_xticks(np.arange(len(alphabet)))
    ax.set_yticks(np.arange(len(schemes)))
    ax.set_xticklabels([symbol for symbol in alphabet])
    ax.set_yticklabels(scheme_names)
    ax.set_xlim(-0.5, len(alphabet)-0.5)
    ax.set_ylim(-0.5, len(schemes)-0.5)
    ax.spines["left"].set_visible(False)
    ax.spines["right"].set_visible(False)
    ax.spines["bottom"].set_visible(False)
    ax.spines["top"].set_visible(False)
    ax.xaxis.set_ticks_position("none")
    ax.yaxis.set_ticks_position("none")

nuc_alphabet = seq.NucleotideSequence.alphabet_amb
prot_alphabet = seq.ProteinSequence.alphabet
pb_alphabet = seq.LetterAlphabet("abcdefghijklmnop")

figure = plt.figure(figsize=(8.0, 5.0))
gs = GridSpec(
    3, 1,
    height_ratios=[len(graphics.list_color_scheme_names(alphabet))
                   for alphabet in (nuc_alphabet, prot_alphabet, pb_alphabet)],
)
ax = figure.add_subplot(gs[0,0])
ax.set_title("Nucleotide color schemes")
plot_colors(ax, nuc_alphabet)
ax = figure.add_subplot(gs[1,0])
ax.set_title("Protein color schemes")
plot_colors(ax, prot_alphabet)
ax = figure.add_subplot(gs[2,0])
ax.set_title("Protein block color schemes")
plot_colors(ax, pb_alphabet)
plt.tight_layout()
plt.show()
