biotite.sequence.graphics.plot_dendrogram
- biotite.sequence.graphics.plot_dendrogram(axes, tree, orientation='left', use_distances=True, labels=None, label_size=None, color='black', show_distance=True, **kwargs)[source]
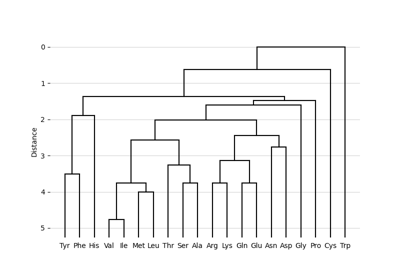
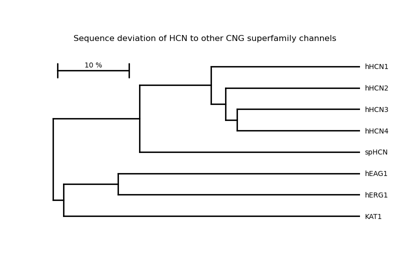
Plot a dendrogram from a (phylogenetic) tree.
- Parameters
- treeTree
The tree to be visualized
- orientation{‘left’, ‘right’, ‘bottom’, ‘top’}, optional
The position of the root node in the plot
- use_distancesbool, optional
If true, the distance attribute of the
TreeNodeobjects are used as distance measure. Otherwise the topological distance is used.- labelslist of str, optional
The leaf node labels. The label of a leaf node is the entry at the position of its index attribute.
- label_sizefloat, optional
The font size of the labels
- colortuple or str, optional
A Matplotlib compatible color, that is used to draw the lines of the dendrogram.
- show_distancebool, optional
If true, the distance from the root is shown on the corresponding axis.
- **kwargs
Additional parameters that are used to draw the dendrogram lines.