


biotite.sequence.graphics.ArrayPlotter
- class biotite.sequence.graphics.ArrayPlotter(axes, fl_score, color_symbols=False, font_size=None, font_param=None)[source]
Bases:
LetterPlotterThis
SymbolPlotterquantitatively decorates sequences alignments, with molecular recognition data obtained from e.g. microarrays. Symbols are visualized as characters on a colored background box. The color of a given box represents the recognition signal. The intensity of the color, is proportional to the strenght of the recognition.- Parameters
- axesAxes
A Matplotlib axes, that is used as plotting area.
- fl_scorenumpy.ndarray
The ndarray to store recognition values corresponding to the score residues. By default, the normalized score is 1 for maximum recognition and 0 for non-recognition (no color).
- color_symbolsbool, optional
If true, the symbols themselves are colored. If false, the symbols are black, and the boxes behind the symbols are colored.
- font_sizefloat, optional
Font size of the sequence symbols.
- font_paramdict, optional
Additional parameters that is given to the
matplotlib.Textinstance of each symbol.
- get_cmap()
- get_color(alignment, column_i, seq_i)
Get the color of a symbol at a specified position in the alignment.
The symbol is specified as position in the alignment’s trace (
trace[pos_i, seq_i]).PROTECTED: Override when inheriting.
- Parameters
- alignmentAlignment
The respective alignment.
- column_iint
The position index in the trace.
- seq_iint
The sequence index in the trace.
- Returns
- colorobject
A Matplotlib compatible color used for the background or the symbol itself at the specifed position
- plot_symbol(bbox, alignment, column_i, seq_i)
Get the color of a symbol at a specified position in the alignment.
The symbol is specified as position in the alignment’s trace (
trace[pos_i, seq_i]).- Parameters
- bboxBbox
The axes area to plot the symbol in
- alignmentAlignment
The respective alignment.
- column_iint
The position index in the trace.
- seq_iint
The sequence index in the trace.
Gallery
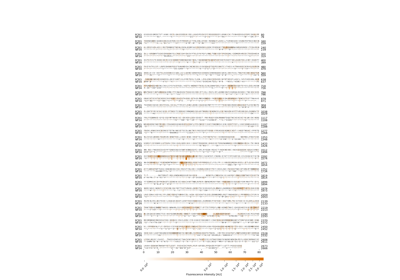
Plot epitope mapping data onto protein sequence alignments
