


Note
Go to the end to download the full example code
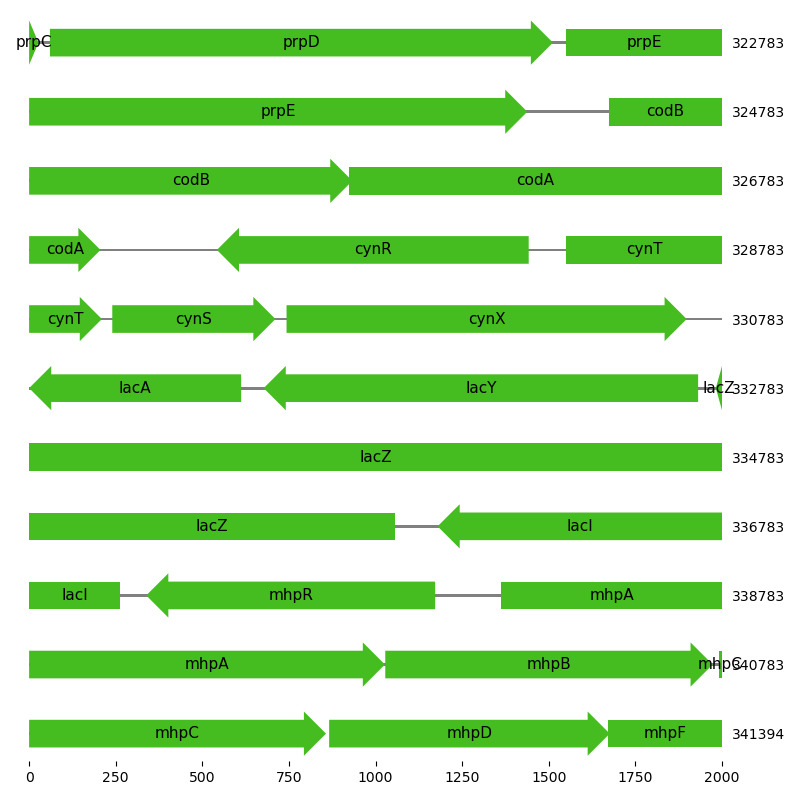
Visualization of region in proximity to lac operon
This script creates a feature map for the region around the lac operon in the E. coli BL21 genome.
# Code source: Patrick Kunzmann
# License: BSD 3 clause

import biotite.sequence as seq
import biotite.sequence.graphics as graphics
import biotite.sequence.io.genbank as gb
import biotite.database.entrez as entrez
import numpy as np
import matplotlib.pyplot as plt

# Download E. coli BL21 genome
file = entrez.fetch("CP001509", None, suffix="gb",
                         db_name="nuccore", ret_type="gb")
gb_file = gb.GenBankFile.read(file)
_, seq_length, _, _, _, _ = gb.get_locus(gb_file)
annotation = gb.get_annotation(gb_file, include_only=["gene"])
# Find the minimum and maximum locations of lac genes
min_loc = seq_length
max_loc = 1
for feature in annotation:
    for loc in feature.locs:
        # Ignore if feature is only a pseudo-gene (e.g. gene fragment)
        # and check if feature is lacA gene (begin of lac operon)
        if "gene" in feature.qual \
            and  "pseudo" not in feature.qual \
            and feature.qual["gene"] == "lacA":
                if min_loc > loc.first:
                    min_loc = loc.first
                if max_loc < loc.last:
                    max_loc = loc.last
# Extend the location range by 1000 (arbitrary) in each direction
min_loc -= 10000
max_loc += 10000
# Visualize the region as feature map

fig = plt.figure(figsize=(8.0, 8.0))
ax = fig.add_subplot(111)
graphics.plot_feature_map(
    ax, annotation, loc_range=(min_loc, max_loc), symbols_per_line=2000,
    show_numbers=True, show_line_position=True
)
fig.tight_layout()

plt.show()
