biotite.structure.graphics.plot_nucleotide_secondary_structure
- biotite.structure.graphics.plot_nucleotide_secondary_structure(axes, base_labels, base_pairs, length, layout_type=Layout.NAVIEW, draw_pseudoknots=True, pseudoknot_order=None, angle=0, bond_linewidth=1, bond_linestyle=None, bond_color='black', backbone_linewidth=1, backbone_linestyle='solid', backbone_color='grey', base_text=None, base_box=None, annotation_positions=None, annotation_offset=8.5, annotation_text=None, border=0.03, bin_path='RNAplot')[source]
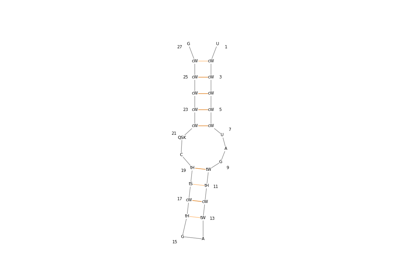
Generate 2D plots of nucleic acid secondary structures using the interface to RNAplot, which is part of the ViennaRNA software package.
Internally a
biotite.application.viennarna.RNAplotAppinstance is created to generate coordinates for each individual base on a 2D plane. ViennaRNA must be installed in order to use this function.- Parameters
- axesAxes
A Matplotlib axes, that is used as plotting area.
- base_labelsiterable
The labels denoting the type of each base.
- base_pairsndarray, shape=(n,2)
Each row corresponds to the positions of the bases in the sequence. The positions are counted from zero.
- lengthint
The number of bases in the sequence.
- layout_typeRNAplotApp.Layout, optional (default: RNAplotApp.Layout.NAVIEW)
The layout type according to the RNAplot documentation.
- draw_pseudoknotsbool, optional (default: True)
Whether pseudoknotted bonds should be drawn.
- pseudoknot_orderiterable, optional (default: None)
The pseudoknot order of each pair in the input base_pairs. If no pseudoknot order is given, a solution determined by
biotite.structure.pseudoknots()is picked at random.- angleint or float, optional (default: 0)
The angle the plot should be rotated.
- bond_linewidthfloat or int or iterable, optional (default: 1)
The linewidth of each bond. Provide a single value to set the linewidth for all bonds or an iterable to set the linewidth for each individual bond.
- bond_linestylestr or iterable, optional (default: None)
The Matplotlib compatible linestyle of each bond. Provide a single value to set the linewidth for all bonds or an iterable to set the linewidth for each individual bond. By default, solid lines are used for non-pseudoknotted bonds and dashed lines are used for pseudoknotted bonds.
- bond_colorstr or ndarray, shape(n,) or shape(n,3) or shape(n,4), optional (default: ‘black’)
The Matplotlib compatible color of each bond. Provide a single string to set the color for all bonds or an array to set the color for each individual bond.
- backbone_linewidthfloat, optional (default: 1)
The linewidth of the backbone.
- backbone_linestylestr, optional (default: ‘solid’)
The Matplotlib compatible linestyle of the backbone.
- backbone_colorstr or ndarray, shape=(3,) or shape=(4,), dtype=float, optional (default: ‘grey’)
The Matplotlib compatible color of the backbone.
- base_textdict or iterable, optional (default: {‘size’: ‘small’})
The keyword parameters for the Matplotlib
Textobjects denoting the type of each base. Provide a single value to set the parameters for all labels or an iterable to set the parameters for each individual label.- base_boxdict or iterable, optional (default: {‘pad’=0, ‘color’=’white’})
The Matplotlib compatible properties of the
FancyBboxPatchsurrounding the base labels. Provide a single dictionary to set the properties of all base lables or an iterable to set the properties for each individual label.- annotation_positionsiterable, optional (default: None)
The positions of the bases to be numbered. By default every second base is annotated. Please note that while the positions in the sequence are counted from zero, they are displayed on the graph counted from one.
- annotation_offsetint or float, optional (default: 8.5)
The offset of the annotations from the base labels.
- annotation_textdict or iterable, optional (default: {‘size’: ‘small’})
The keyword parameters for the Matplotlib
Textobjects annotating the sequence. Provide a single value to set the parameters for all annotations or an iterable to set the parameters for each individual annotation.- borderfloat, optional (default: 0.03)
The percentage of the coordinate range to be left as whitespace to create a border around the plot.
- bin_pathstr, optional
Path to the RNAplot binary.