


biotite.sequence.graphics.plot_feature_map
- biotite.sequence.graphics.plot_feature_map(axes, annotation, loc_range=None, multi_line=True, symbols_per_line=1000, show_numbers=False, number_size=None, line_width=0.05, show_line_position=False, spacing=0.25, feature_plotters=None, style_param=None)[source]
Plot a sequence annotation, by showing the range of each feature on one or multiple position depicting line(s).
This function uses
FeaturePlotterobjects to draw the features. This function internally uses a list of plotters, where the first plotter in the list, that supports a feature, is used to draw that feature. The amount of features that can be visualized by default is limited. Features, that are not supported otherwise, are visualized as simple rectangles. AdditionalFeaturePlotterobjects, that are supplied in the feature_plotters parameters, can be used to add support for further features or to customize the appearance of certain features.- Parameters
- axesAxes
A Matplotlib axes, that is used as plotting area.
- annotationAnnotation
The annotation to be visualized.
- loc_rangetuple (int, int), optional
The start and exclusive stop location that is visualized. By default, the location range starts from the first base/residue and ends at the last base/residue of all features, ensuring that the entire annotation is drawn.
- multi_linebool, optional
If true, the annotation is segmented into multiple lines with a line break all symbols_per_line lines. Otherwise, the entire location range is put into a single line.
- symbols_per_lineint, optional
The amount of Does not have an effect, if multi_line is false.
- show_numbersbool, optional
If true, the sequence position the base/residue of a line is shown on the right side of the plot.
- number_sizefloat, optional
The font size of the position numbers
- line_widthfloat, optional
The size of the continuous line as fraction of the height of the drawn features.
- show_line_positionbool, optional
If true the position within a line is plotted.
- spacingfloat, optional
The size of the spacing between the lines as fraction of the height of the drawn features.
- feature_plotterslist of FeaturePlotter, optional
Custom plotters for features. The list is iterated from the beginning until a
FeaturePlottermatches the respective feature (FeaturePlotter.matches() returns True). ThisFeaturePlotteris then used to draw the feature. Therefore, theFeaturePlotterinstances in the list have descending priority. The default plotters are appended after this supplied list, i.e. the default plotters have a lower priority.- style_paramdict
Additional style parameters that are given to the
FeaturePlotterobjects.
Notes
Good visulation results are obtained only for non-overlapping features. When two features overlap, their drawing area does also overlap.
Gallery

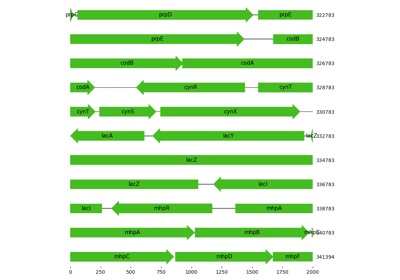
Visualization of region in proximity to lac operon
Three ways to get the secondary structure of a protein
